Dataflexor
Visualize your Spreadsheets and Discover Trends & Correlations. Generate easy-to-understand charts from complicated spreadsheets with just a few clicks.
Description
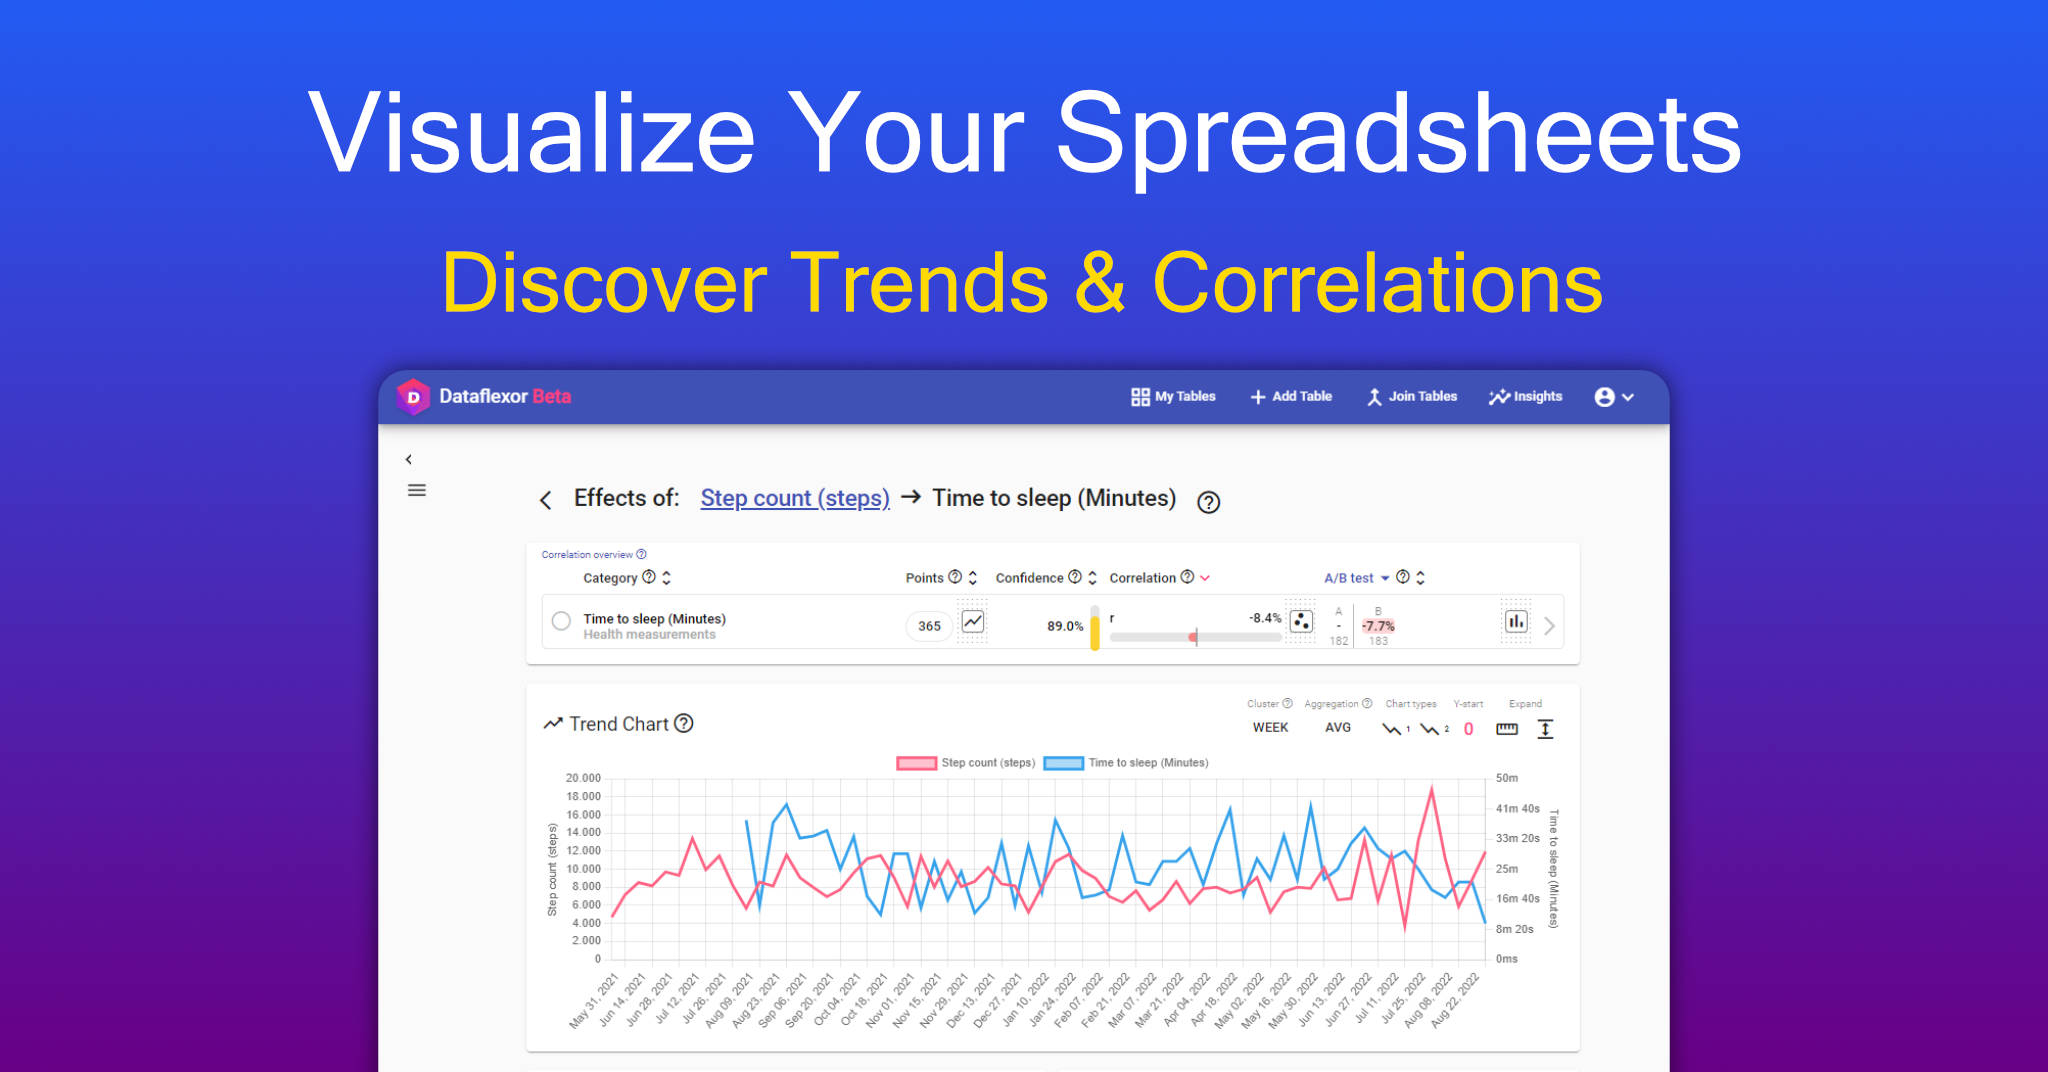
Spreadsheets are great for storing data, but not easy for people to read and gain insights from. Charts, on the other hand, let us understand huge amounts of data with ease.
So wouldn't it be nice to be able to generate easy-to-understand charts from a complicated spreadsheet with just a few clicks?
With Dataflexor, this is no longer a problem. Just load your spreadsheet and get instant insights without much configuration.
Stage
Public beta
Platforms
- Website/Web app
Launch date
August 01, 2022
Published
January 27, 2023